Financial Highlights
Swipe left to see.
| 2021/3 | 2022/3 | 2023/3 | 2024/3 | 2025/3 | 2026/3 | |
|---|---|---|---|---|---|---|
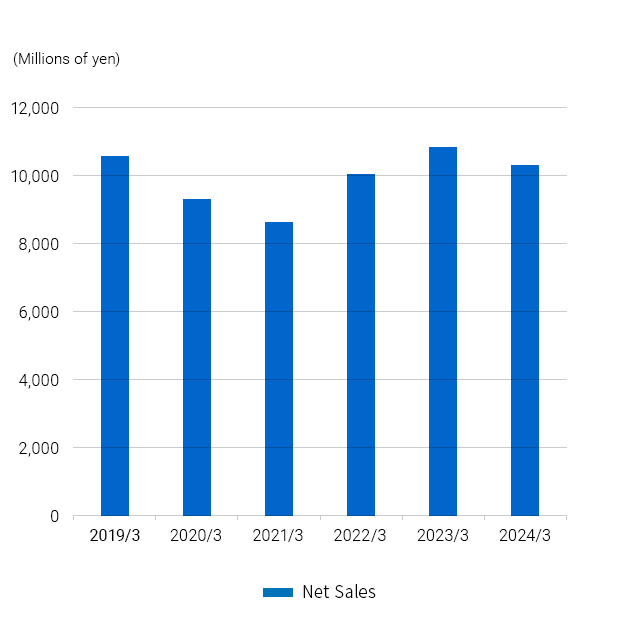
| Net Sales (Millions of yen) | 8,655 | 9,979 | 10,733 | 10,239 | 10,077 | 11,341 |
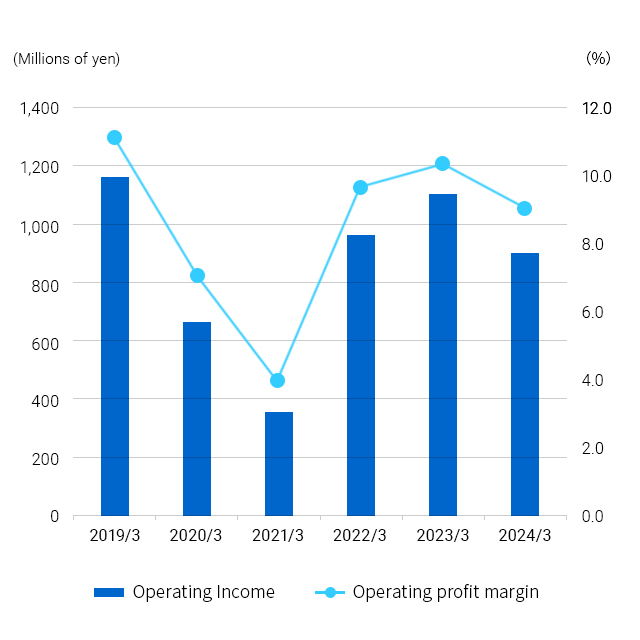
| Operating Income (Millions of yen) | 363 | 972 | 1,102 | 918 | 638 | 1,071 |
| Operating profit margin (%) | 4.2 | 9.7 | 10.3 | 9.0 | 6.3 | 9.4 |
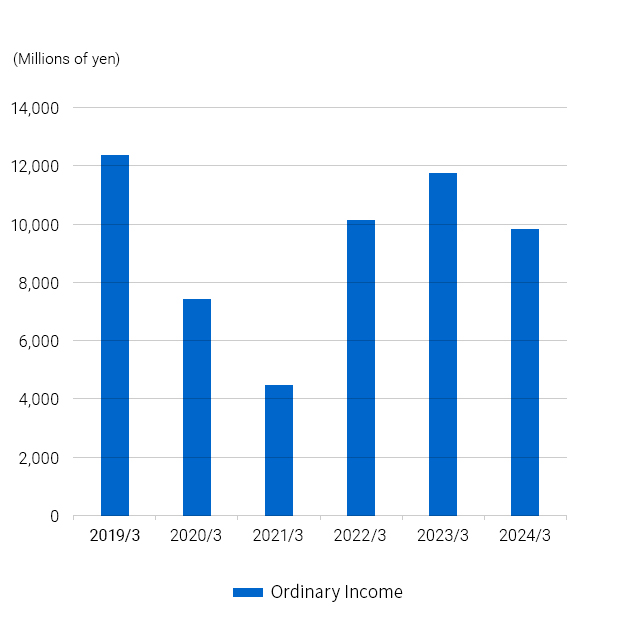
| Ordinary Income (Millions of yen) | 440 | 1,028 | 1,177 | 992 | 720 | 1,146 |
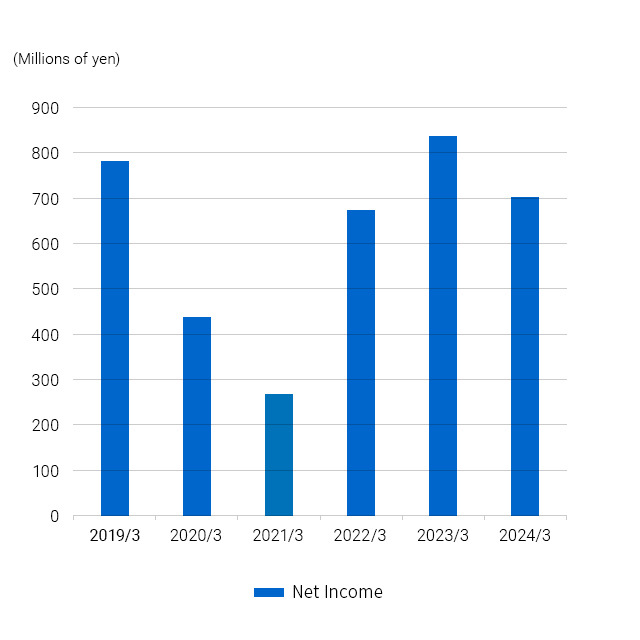
| Net Income (Millions of yen) | 275 | 672 | 835 | 702 | 504 | 776 |
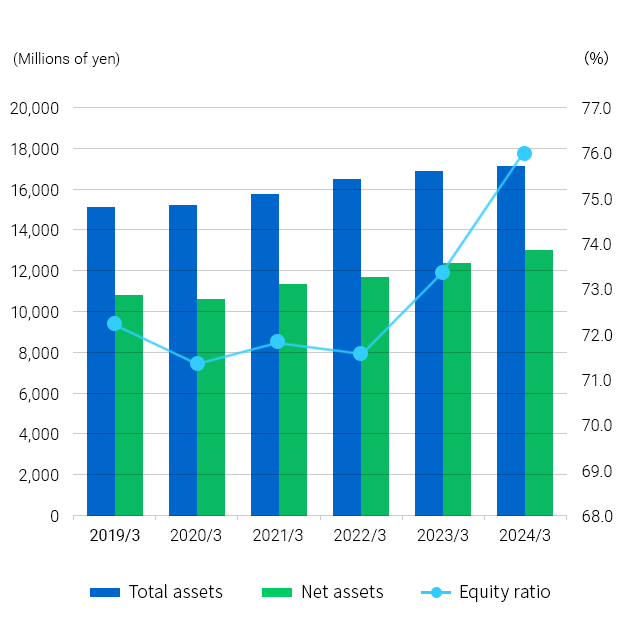
| Total assets (Millions of yen) | 15,930 | 16,534 | 16,895 | 17,191 | 17,125 | 18,853 |
| Net Assets (Millions of yen) | 11,430 | 11,786 | 12,394 | 13,073 | 13,113 | 14,137 |
| Equity ratio (%) | 71.8 | 71.3 | 73.4 | 76.0 | 76.6 | 75.0 |
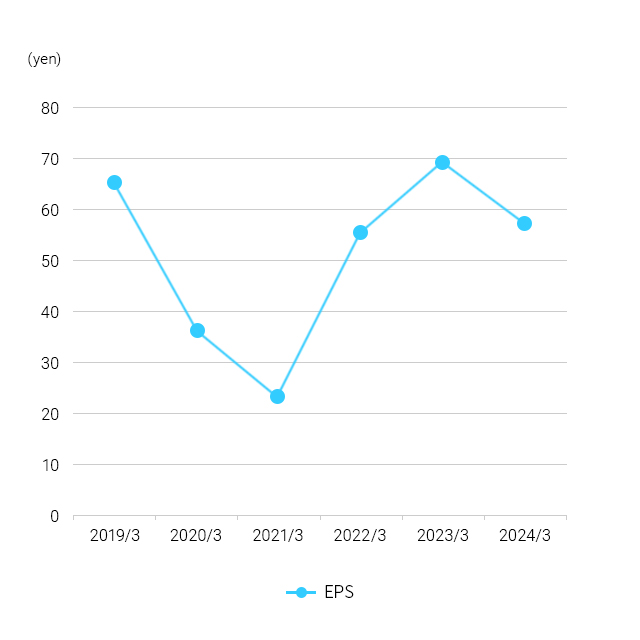
| EPS (yen) | 23.00 | 56.29 | 69.99 | 58.81 | 42.16 | 64.90 |
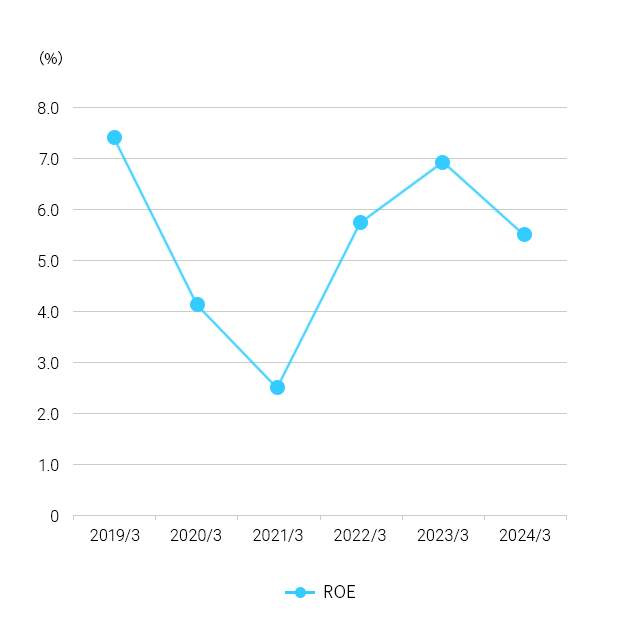
| ROE (%) | 2.5 | 5.8 | 6.9 | 5.5 | 3.8 | 5.7 |
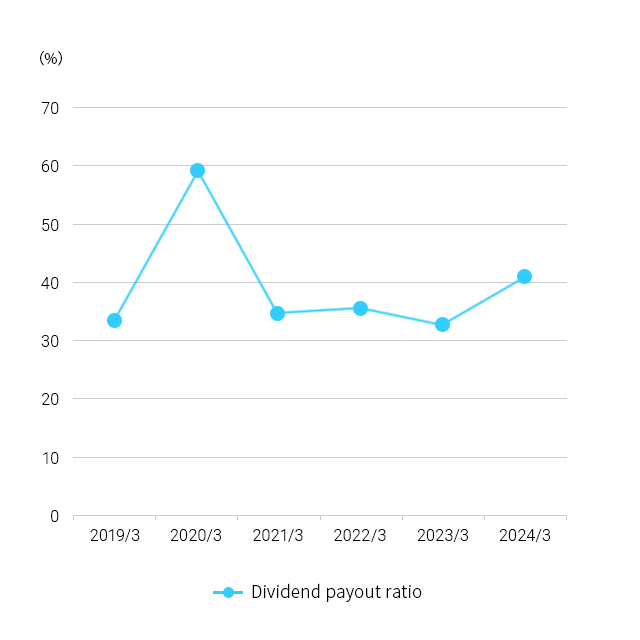
| Dividend payout ratio (%) | 34.8 | 35.5 | 32.9 | 41.3 | 50.4 | 32.4 |
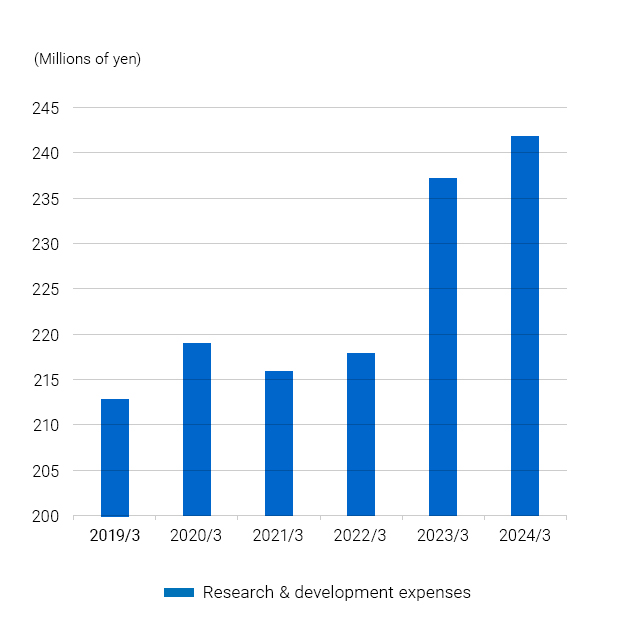
| Research & development expenses (Millions of yen) | 216 | 218 | 237 | 242 | 257 | 313 |
Net Sales
Operating Income, Operating profit margin
Ordinary Income
Net Income
Total assets, Net assets, Equity ratio
EPS
ROE
Dividend payout ratio
Research & development expenses